What would Quebec look like under proportional representation?
Another election, another drastically distorted seat mapping. As we do with every election, let's calculate how it would look with a real democratic system.

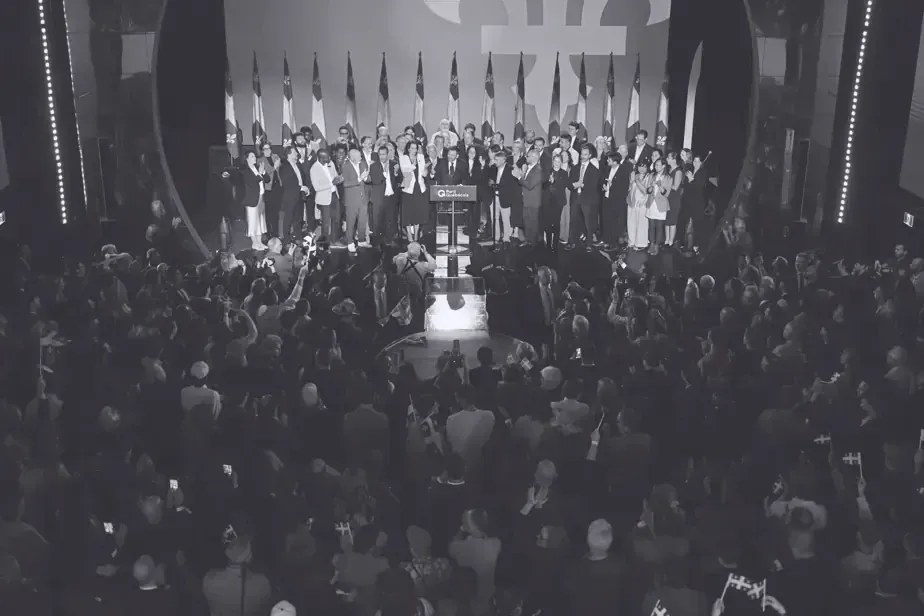
The election in Quebec this week was a perfect example of how poorly designed Canada’s first-past-the-post system is for a complex, diversified electorate in 2026. That being said, it isn’t the worst we’ve seen in the past few years. That goes to Ontario 2022, 2025, and Quebec 2022.
The Parti Quebecois won 46 percent of seats with 28 percent of votes.The Liberals received a major advantage as well. With 24 percent of the vote, they received 31 percent of seats. Meanwhile, the CAQ received more votes than Quebec Solidaire but walked away with zero seats. QS and Parti Conservateur received major seat penalties as well. QS got 12 percent of the vote, but only 7 percent of seats. PCQ won 21 percent of the vote, but only 14 percent of seats.
This is a brutal distribution. It’s not nearly as bad as 2022 however, where CAQ with 40 percent of votes received 70 percent of seats.
*Editors note: the charts do not work properly in email. Please read this in your browser. You’ll love it.
We calculated this, of course, and in response to this travesty of democratic representation, we created an algorithm to simulate what the province would look like under a PR-STV system. We wound up publishing an excellent article with the Walrus about this. That article was focused on the 2025 federal election, which wasn’t that bad relative to FPTP, but when we look at 2019 and 2021 federal elections, they look much closer to what we saw this week in Quebec.
Quebec has changed. We are more diverse, and there is no singular way of thinking anymore. Quebecers have become a more interesting people ideologically, and questions such as federalist/sovereigntist only capture a bit of who we are. Today, our parties are a broad group. Although most of them are right of centre, the expression of this is different. The PQ tends to offer center/slightly left of centre views on social programs while being ultra right wing on identity issues. The CAQ was centre right on most things. The Liberals are somewhat left on identity issues, with a right of centre economic policy. The conservatives are far right on both, and QS is centre left on both economy and identity. This isn’t the days of Rene Levesque, where the PQ was centre left and the Liberals were centre/centre left. The world is complex, Quebecers are more complex, and our voting system does not meet the demands of modernity.
So I improved the algorithm again, making it do 10,000 simulations at a time and adding in what I call a “disaster matrix.” The disaster matrix calculates a 5% chance of scandal or mass human error that absolutely destroys a party. Using these simulations with a disaster matrix, we calculated the lowest and highest possible seats of every party. Here are the results of this week, compared with our simulation.
*Editors note: the charts do not work properly in email. Please read this in your browser. You’ll love it.